How to Get Real-Time HR Insights Without Technical Skills
October 7, 2026 | By Gopareto Marketing
How many people are absent today? Is overtime creeping up? How much leave is the team carrying into the holiday season? Which visas expire next quarter? These are simple questions, yet in many small and mid-sized businesses answering them means exporting spreadsheets, merging files and waiting for whoever “knows Excel”.
By the time the answer arrives, it is already out of date.
You don’t need a data analyst, formulas or a reporting tool to get real-time HR insights. You need your HR data in one place, a short list of metrics that matter, and dashboards that update on their own. This guide shows you how to set that up and how to read what you see, using dashboards and reports for teams in Australia, India and the UAE.
What “Real-Time HR Insights” Actually Means
The terms get used loosely. Here is what each one means in practice.
A single number that tracks something important, such as absence rate or overtime hours this month.
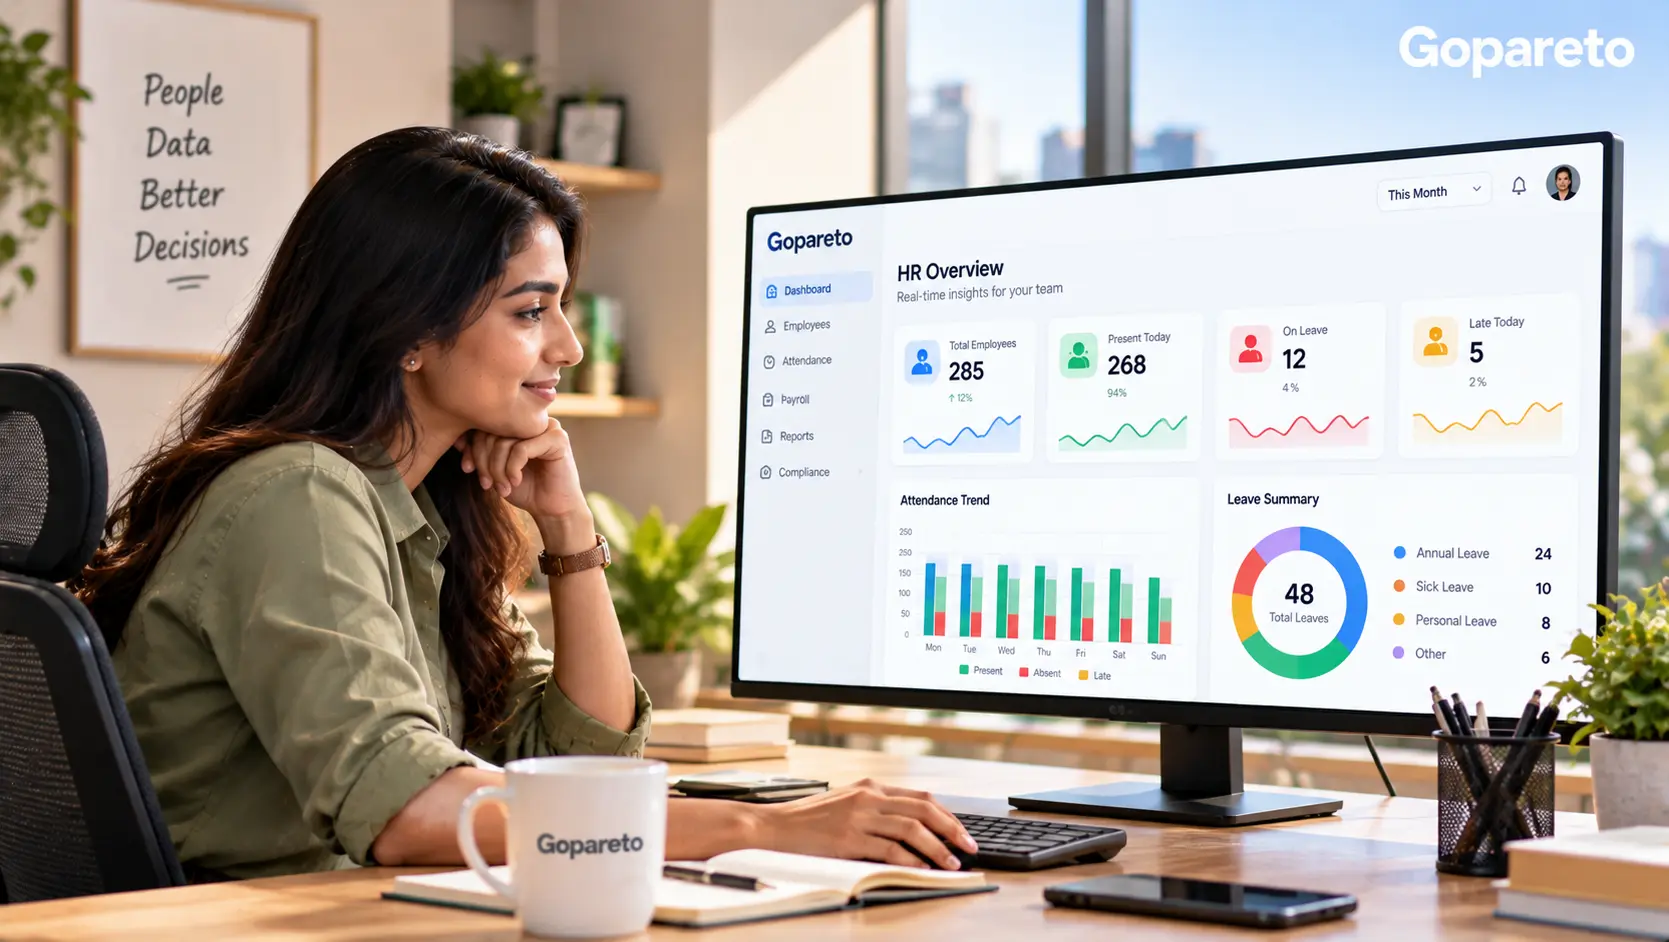
A screen showing your key metrics at a glance, updated automatically as attendance, leave and payroll data change.
A detailed breakdown for a chosen period, filtered by team, location or employee, that you can export or share.
A notification when something crosses a line you set, such as a visa expiring within 60 days or overtime above budget.
“Real-time” simply means the numbers come straight from the system where work is recorded—clock-ins, leave approvals, pay runs—rather than from a spreadsheet someone updated last month.
The HR Metrics Worth Watching
Start with a handful of metrics. Each one below can be read without any calculation once your system tracks it, but knowing the formula helps you trust the number.
| Metric | How it’s calculated | What it tells you |
|---|---|---|
| Headcount | Active employees, by team or location | Your baseline for every other metric |
| Absence rate | Unplanned absence days ÷ scheduled working days × 100 | Early warning of burnout, morale or health issues |
| Late arrivals | Clock-ins after shift start, per week | Rostering, transport or engagement problems |
| Overtime | Overtime hours and cost, by team, per pay period | Under-staffing and budget overruns |
| Leave balances | Accrued but untaken leave, by person and team | Burnout risk and the leave liability on your books |
| Payroll cost | Total employment cost per period, and as a share of revenue | Whether staffing costs are growing faster than the business |
| Staff turnover | Leavers in the period ÷ average headcount × 100 | Retention problems in specific teams or roles |
| Leave approval time | Average days from request to decision | Bottlenecks with particular managers |
| Timesheet completion | Timesheets submitted on time ÷ timesheets due | Payroll and billing accuracy risk |
| Compliance status | Upcoming and overdue lodgements and expiries | What needs action this week |
Worked example: absence rate
A team of 25 full-time employees has 21 working days in a month, so 525 scheduled days. If there were 16 days of unplanned absence, the absence rate is 16 ÷ 525 × 100 = 3.0%. On its own that number means little. Compared with 1.8% last month, it is worth a conversation.
Country-Specific Numbers to Keep an Eye On
| Country | Useful views |
|---|---|
| Australia | Super paid per pay run at the 12% SG rate, with Payday Super timing from 1 July 2026; annual and personal/carer’s leave balances; staff affected by award rate changes each July |
| India | Employees close to the ₹21,000 ESI wage ceiling; PF contributions at 12% employee and 12% employer; staff approaching five years’ service and gratuity eligibility |
| UAE | Upcoming visa, work permit and Emirates ID expiries; accrued end-of-service gratuity; WPS salary payment status |
How to Get HR Insights Without Technical Skills
Start with your questions
Write down the five questions you ask most often, such as “Who’s off this week?” or “Why is payroll up?”. Every dashboard should answer one of them.
Get your data into one system
Insights are only as current as the data behind them. When attendance, leave, timesheets and payroll live in one HR system, nothing has to be merged.
Use built-in dashboards and reports
Choose software with ready-made views for the metrics above. You pick the report, the period and the filter; the system does the maths.
Filter and save your views
Filter by team, location or country and save the views you use most, so “Sydney overtime this month” is one click away.
Set alerts for thresholds
Rather than checking constantly, let the system tell you when overtime passes a limit, a leave balance gets too high or a document is about to expire.
Build a review rhythm
Look at the right numbers at the right frequency, as below. Ten minutes a week beats a two-day analysis once a year.
A Simple Review Rhythm
Daily (2 minutes)
- Who is absent or on leave today
- Missed or late clock-ins
- Leave requests awaiting approval
Weekly (10 minutes)
- Overtime by team against budget
- Timesheets outstanding before payroll cut-off
- Compliance deadlines in the next two weeks
Monthly (30 minutes)
- Absence rate and turnover compared with last month and last year
- Payroll cost trend and leave balances by team
- Upcoming visa, permit and certification expiries
Compliance deadlines deserve their own place on the weekly view; our guide on how to track regulatory deadlines without missing them explains how to build that calendar.
How to Read a Dashboard Without Getting Misled
- Compare, don’t stare: a number means something only next to last month, last year or a target
- Watch trends: three months of rising overtime matters more than one busy week
- Drill into outliers: click through from the team figure to the people behind it
- Mind small numbers: in a team of five, one long illness can double the absence rate
- Add context: a seasonal peak or a new hire intake explains many spikes
- Ask before acting: a dashboard shows what is happening; a conversation tells you why
Rising overtime is one of the most common signals. If you see it, check that it’s being paid correctly too—see how to calculate overtime automatically. Shift-heavy operations get the most from these views; our guide to the best HR software for manufacturing and warehousing looks at that in detail.
Common Mistakes to Avoid
Tracking too much
- Thirty charts nobody reads help no one
- Start with five metrics tied to real decisions
Trusting dirty data
- Missed clock-outs and unrecorded leave distort every metric
- Fix data capture before building reports
Keeping spreadsheets alongside
- Two sources of truth lead to arguments about which is right
- Retire the spreadsheet once the system is live
Using data to police people
- Insights should start conversations, not replace them
- Focus on patterns and teams, not catching individuals
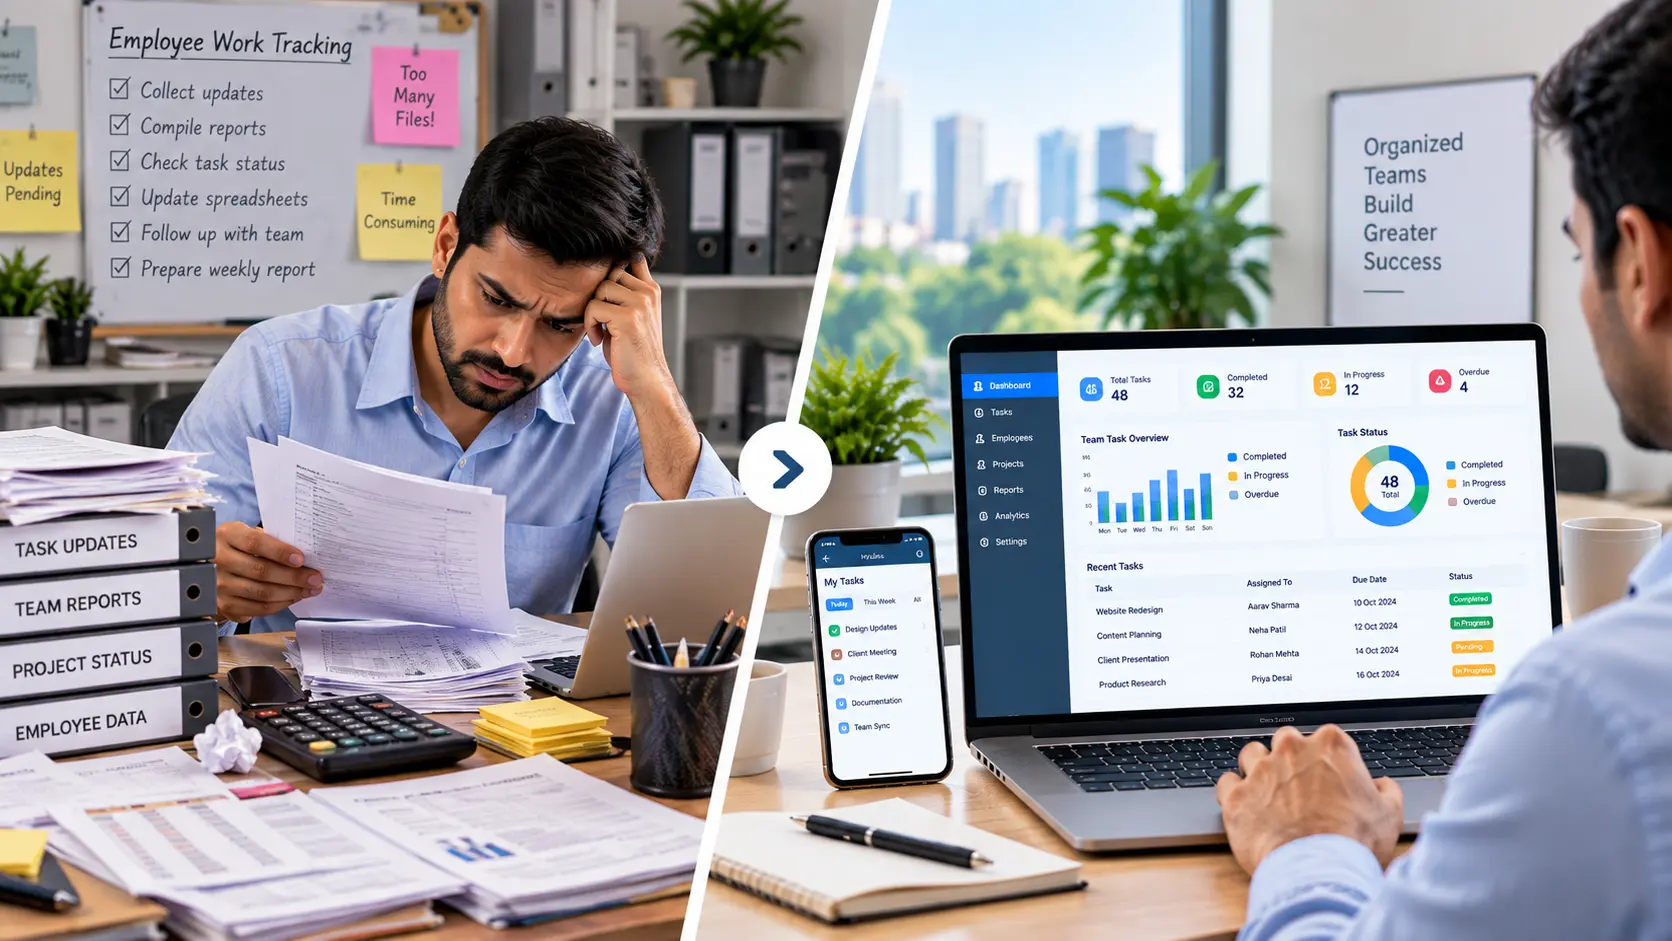
If your attendance and work data still lives in spreadsheets, start there: see how to track employee work without spreadsheets or manual reports.
Protect employee data
- Give managers access only to their own team’s data, and HR the wider view
- Share team-level summaries rather than individual records wherever possible
- Follow the privacy law that applies to you, such as India’s DPDP Act or Australia’s Privacy Act
Frequently Asked Questions
Usually not. Most small and mid-sized businesses get what they need from the dashboards and reports built into their HR and payroll system, as long as all the data lives there.
Attendance and leave should update as they happen. Payroll figures update each pay run. That is “real-time” enough for nearly every decision.
Pick the one tied to your biggest current problem: overtime if costs are rising, absence if cover is a struggle, turnover if people keep leaving.
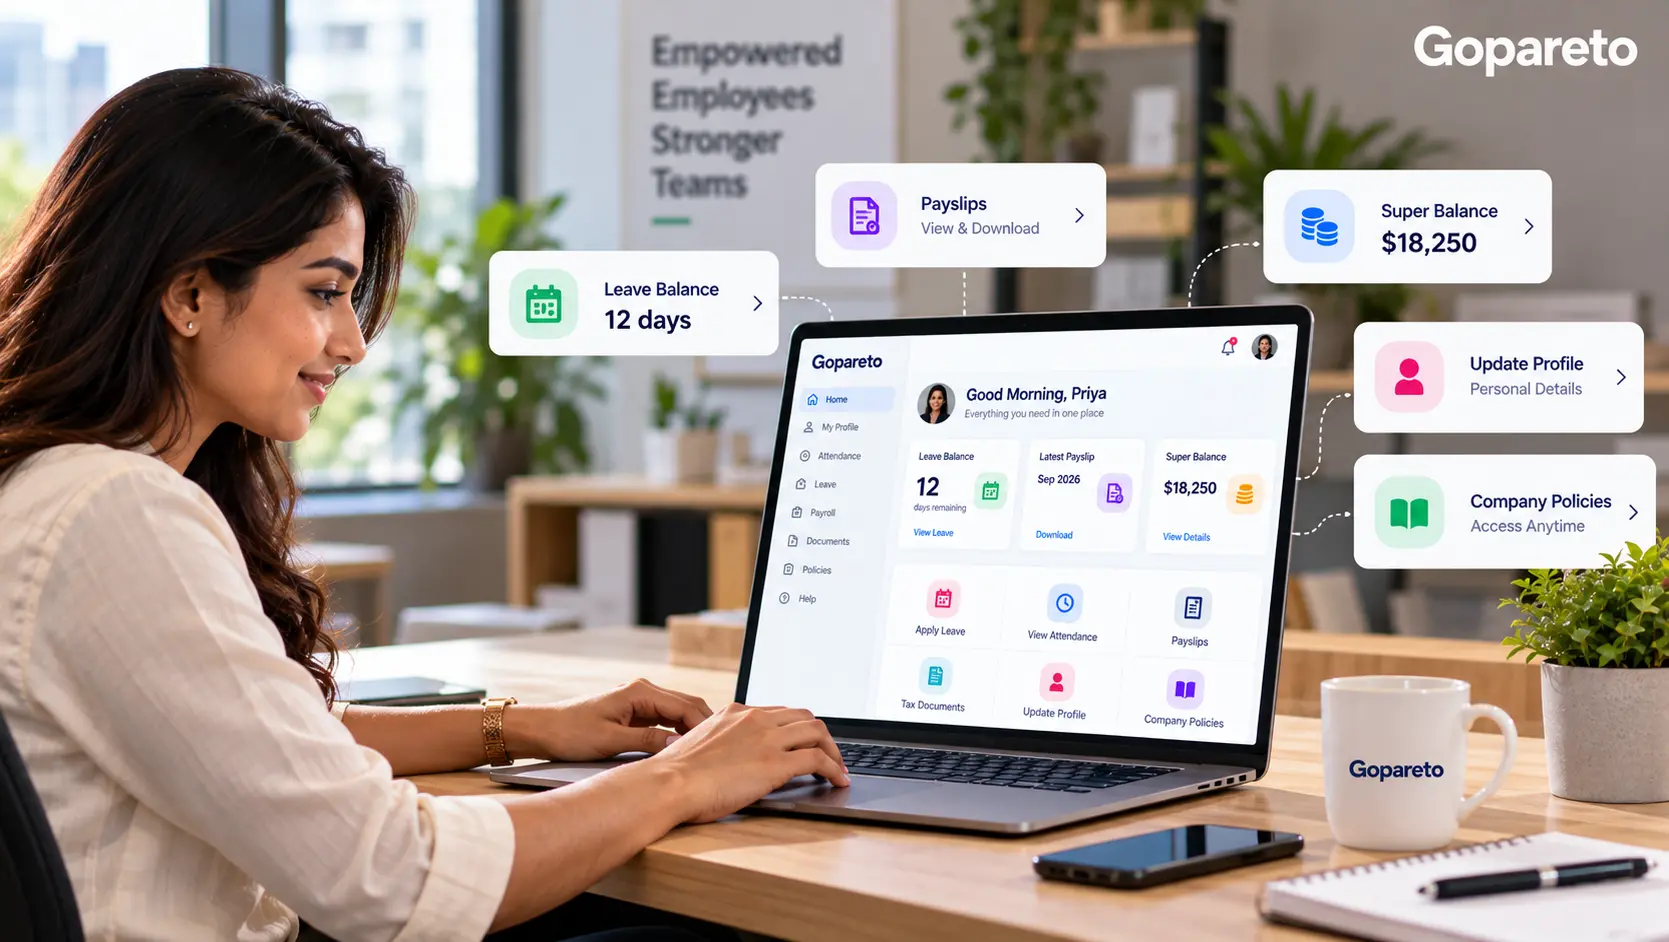
Yes, and they should. A self-service portal lets employees check their own leave, attendance and payslips, which also cuts down routine HR questions.
Conclusion
Real-time HR insights aren’t about technical skills. They come from keeping attendance, leave, timesheets and payroll in one system, choosing a few metrics that answer real questions, and checking them on a steady rhythm. Start with five numbers, compare them over time, set alerts for the things that can’t wait, and use what you see to start better conversations with your team.
Insight works both ways: when employees can see their own data, they ask HR less—read how to reduce HR questions with self-service portals. To see the kind of reporting GoPareto provides, visit our reports feature page.
Ready to see your HR data clearly?
How GoPareto Helps
- Attendance, leave, timesheets and payroll in one system, so reports are always current
- Ready-made reports you can filter by team, location or period
- Reminders for approvals, deadlines and upcoming expiries
- Role-based access for teams in India, Australia and the UAE
Visit Us
GoPareto - Simple & Complete Business Management solution, Omkar Nandan Apartment, A1 201, near Navale Bridge, Kudale Baug, Narhe, Pune, Maharashtra 411041.
Related Blogs